When the maps of progress overlap, the gaps start to matter more
Two of this year’s most consulted reports, the State of AI Report 2025 and Stanford’s AI Index 2025, converge on the same story: capability keeps rising, costs and infrastructure are heavier constraints, and governance is catching up. Their alignment is useful. It also throws the missing pieces into sharper relief. State of AI+1
I’ve written about “Flash Aliances” (https://formarehq.com/field-notes/flashpartnerships-are-coming) previously, however what follows is the shared map in three charts, then the areas I am watching because they decide who captures value next.
Chart 1. Rising compute, slower gains on familiar benchmarks
AI Index data shows a maturing field. Smaller models have improved, inference has become much cheaper, and across several staple tasks the y/y gains are smaller than the early frontier leaps. The chart below normalizes training compute against aggregate benchmark improvement to make that deceleration legible.
Image: AI Index Rising Compute, Flattening Benchmark Gains

Notes: Constructed from AI Index trends; use the AI Index figures for board grade quoting. Stanford HAI
Chart 2. Capital gravity and concentration
Nearly half of Q3 2025 venture dollars went to AI, with global VC at roughly 97 billion and around 46 percent of that to AI‑labeled rounds. The concentration is the signal. When funding concentrates, distribution narrows, and ecosystem gatekeepers harden.
Image: State of AI Capital Gravity and Concentration

Notes: trend line illustrates the share culminating in Q3 2025; figures sourced from Reuters and Crunchbase tallies. Reuters+1
Chart 3. The uncharted metric: dependency versus control
Most organizations are increasing their reliance on third party AI services faster than they increase their ability to audit, self host, or swap those services. That is dependency without control.
Image: AI Dependency vs Control Ratio
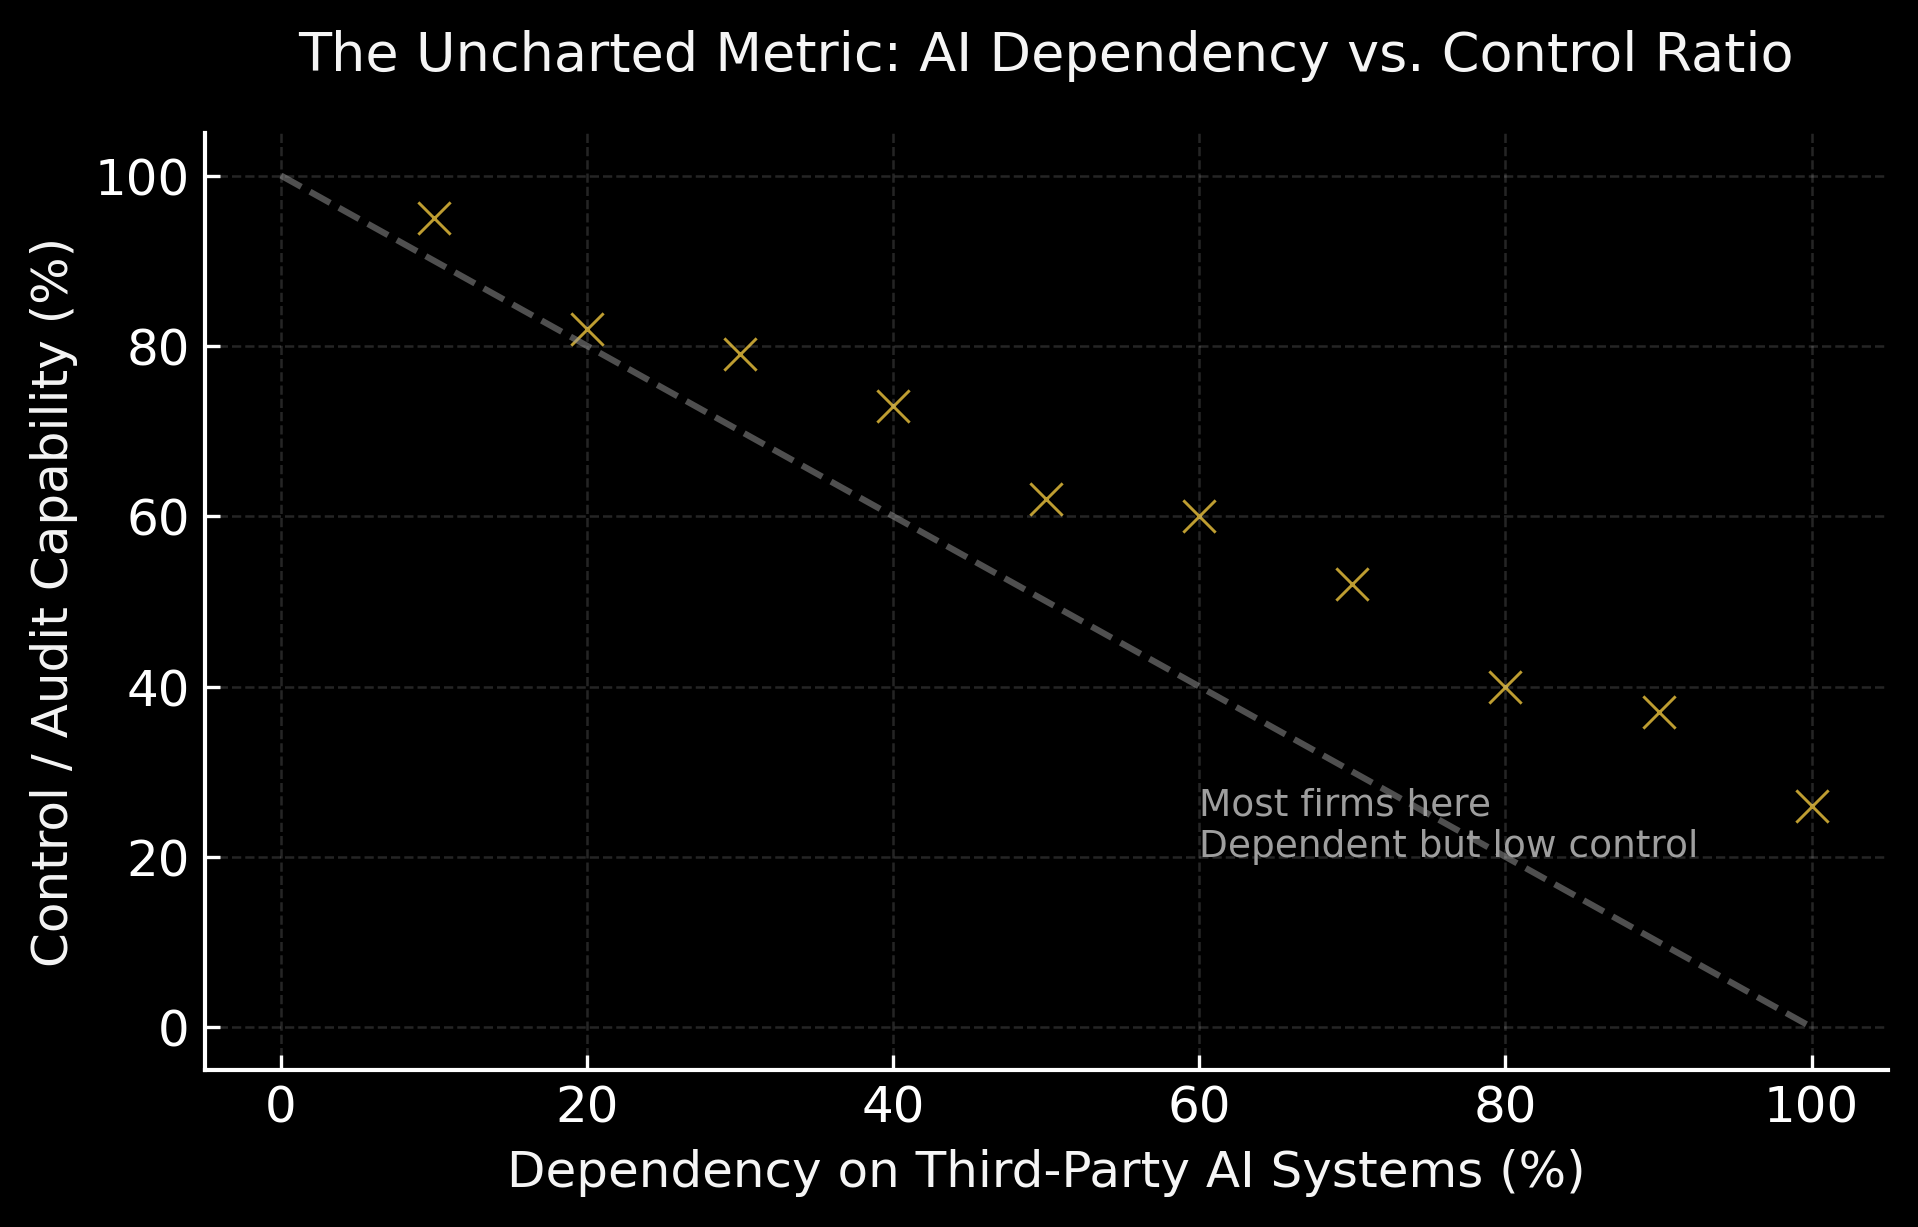
Notes: this is a conceptual chart; the ratio is what I would like to see reported and standardized in 2026.
What I am watching next
Operational friction
Neither report measures the lived drag between proof of concept and production: procurement lead times, privacy reviews, model eval cycles, integration hours, retraining windows. That friction arbitrages advantage to operators who can move data, trust, and decisions faster than peers. Stanford HAI
Ecosystem leverage and product partnerships
AI does not scale in isolation; it scales through CRMs, ERPs, marketing suites, and service tooling. The quiet power is in what I refer to as rails: APIs, marketplaces, data standards, and certification programs that decide which capabilities are allowed to land. For SMBs, the choice of stack will determine whether they get compounding distribution or become a feature inside someone else’s platform. For enterprises, the risk is vendor lock in that outpaces the audit layer.
What I am tracking:
• Where foundation model providers and vertical SaaS form product partnerships that become default infrastructure.
• How SMB facing software becomes the distribution system for embedded AI, not just a sales channel.
• How “API middle layers” consolidate power by controlling identity, privacy boundaries, and attribution flows.
• How partner certification programs create a two speed economy: companies inside the integration network and those outside it.
Capital concentration and its downstream effects
Capital is a channel. With AI taking close to half of quarterly venture, attention, talent, and partner programs flow toward the same nodes. That raises the bar for everyone else and accelerates dependency on the ecosystems those nodes control. Reuters+1
Governance and the audit layer
Both sources show rising attention to responsible AI and incidents. The next question is practical: what is the all‑in cost of being auditable at scale, and at what point does audit cost exceed model uplift for the mid‑market. Stanford HAI+1
A note on data access
Where the analysis requires it, I can validate conclusions against raw usage funnels, event logs, and deployment telemetry. That lets us test alternative weightings and separate narrative from ground truth. For publication, I anchored it to primary sources: the State of AI 2025 release and the AI Index 2025 report. State of AI+1
Sources
• State of AI Report 2025 launch and overview, Air Street Capital. State of AI+1
• Stanford HAI — The 2025 AI Index Report and summary in ten charts. Stanford HAI+1
• Reuters and Crunchbase on Q3 2025 venture funding share to AI. Reuters Crunchbase News